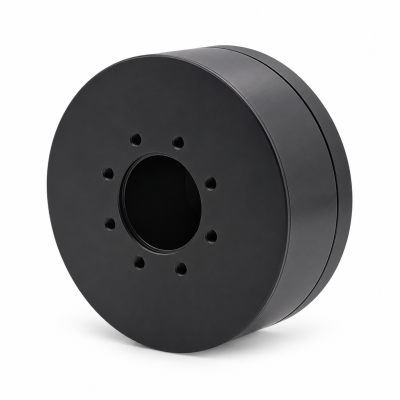
MG3505-8
 MG3505-9
 MG3505-36
 MG4315-8
 MG6010-6
 MG6010-8
 MG4305-10
 MG4310-10
 MG4310-36
 MG4310-40
 MG3510-8
 MG3510-64
 MG6010-36
 MG6010-48
 MG8108-6
 MG8108-8
 MG8108-36
 MG8108-48
 MG8115-6
 MG8115-9
 MG8115-36
 T-4024
 T-4929
 T-6034
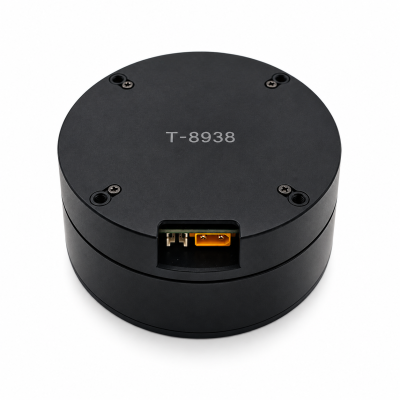
 T-8938
What Is Motor Efficiency and How Does It Affect Robot Design?
SOLISMOTOR · TECHNICAL GUIDES
Motor efficiency is the fraction of electrical input power converted into mechanical output at a stated operating point. For robot design, it helps you assess electrical demand and heat, but its value depends on speed, torque, temperature and the components included in the measurement. When comparing the Robot Joint Motor range, ask for data that match your axis's working conditions before treating a peak efficiency figure as a selection criterion.
A robot joint may spend much of its time moving slowly, holding a load or changing direction. Its most efficient operating point can be far from the conditions that limit the design. The useful question is how much loss the actuator produces where your robot must work, and whether the assembled joint can remove that heat.
1. Define what the efficiency figure includes
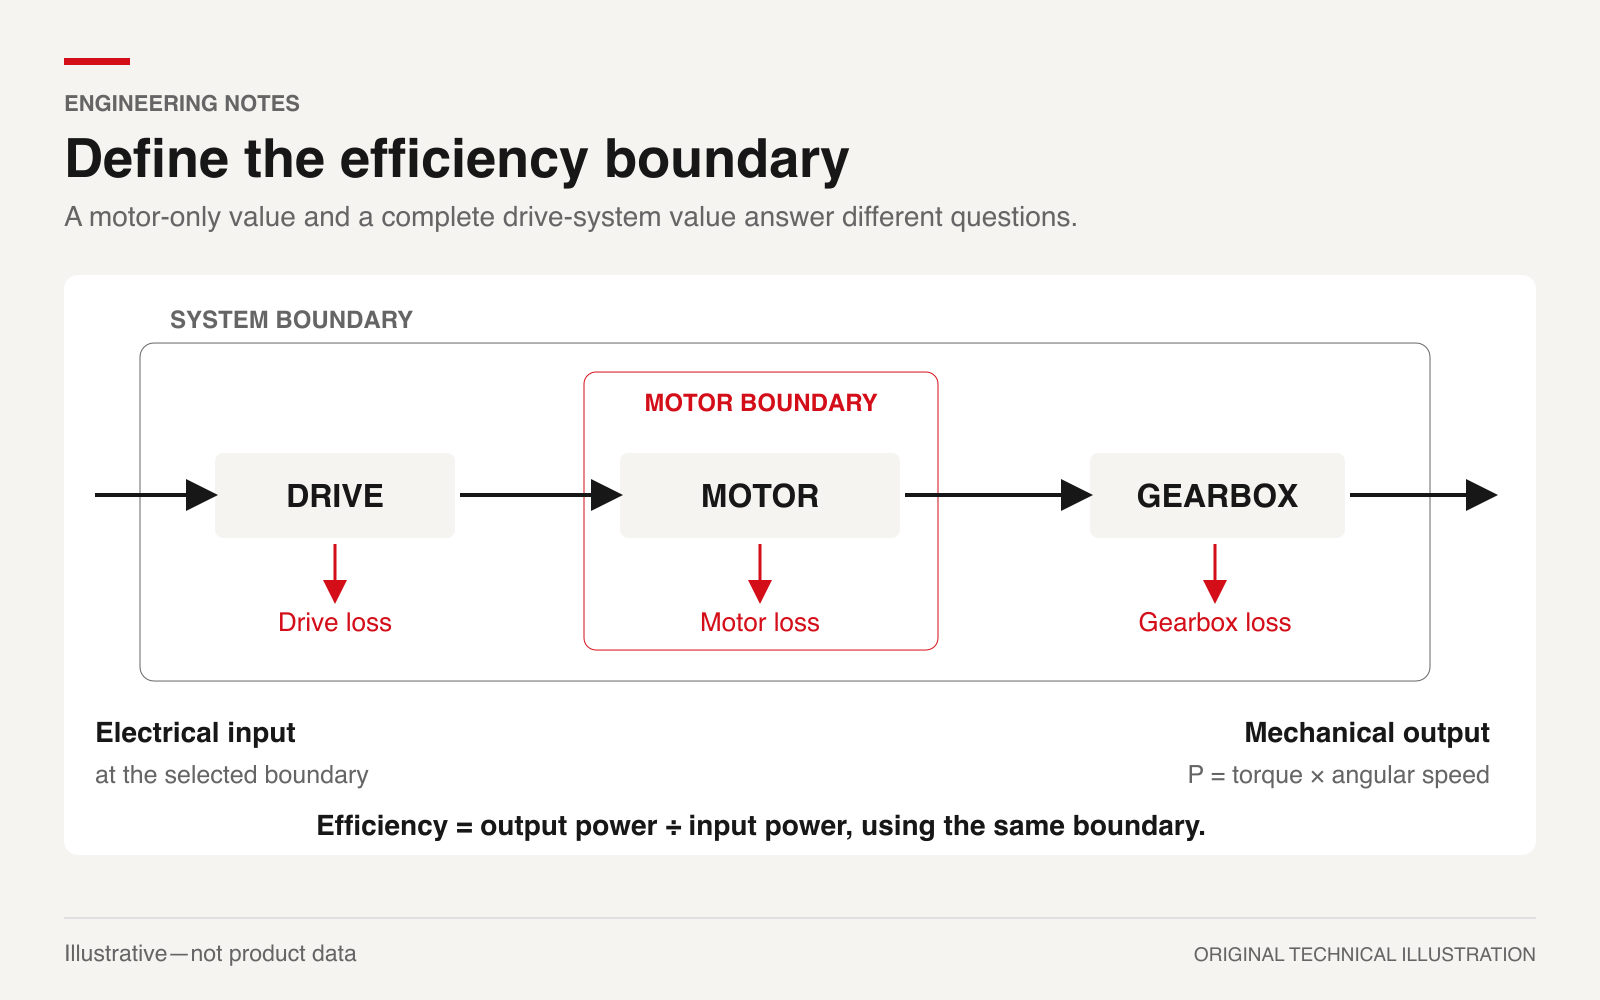
For steady motoring operation with positive mechanical output:
η = P_out / P_in
Multiply this ratio by 100 to express efficiency as a percentage. The input and output must belong to the same defined assembly. The US Department of Energy's motor and drive-system sourcebook (external source) explains efficiency and the distinction between component and system performance.
A motor-only result compares electrical power entering the motor with mechanical power leaving its shaft. A drive-and-motor result starts at the drive's electrical input and therefore includes drive losses. A complete joint result can also include a transmission and its losses, with output measured at the joint shaft. State whether encoder, control electronics and other auxiliary loads are inside the boundary.
These figures answer different purchasing questions. Before comparing two quotations, ask each supplier to identify the electrical terminals, mechanical shaft and included components. A higher motor-only percentage does not establish which complete actuator will draw less input for your required output.
This definition applies to positive motoring. Braking and reverse power flow require their own stated convention; do not interpret a motoring efficiency map as a recovery guarantee.
2. Read efficiency as a map of working conditions
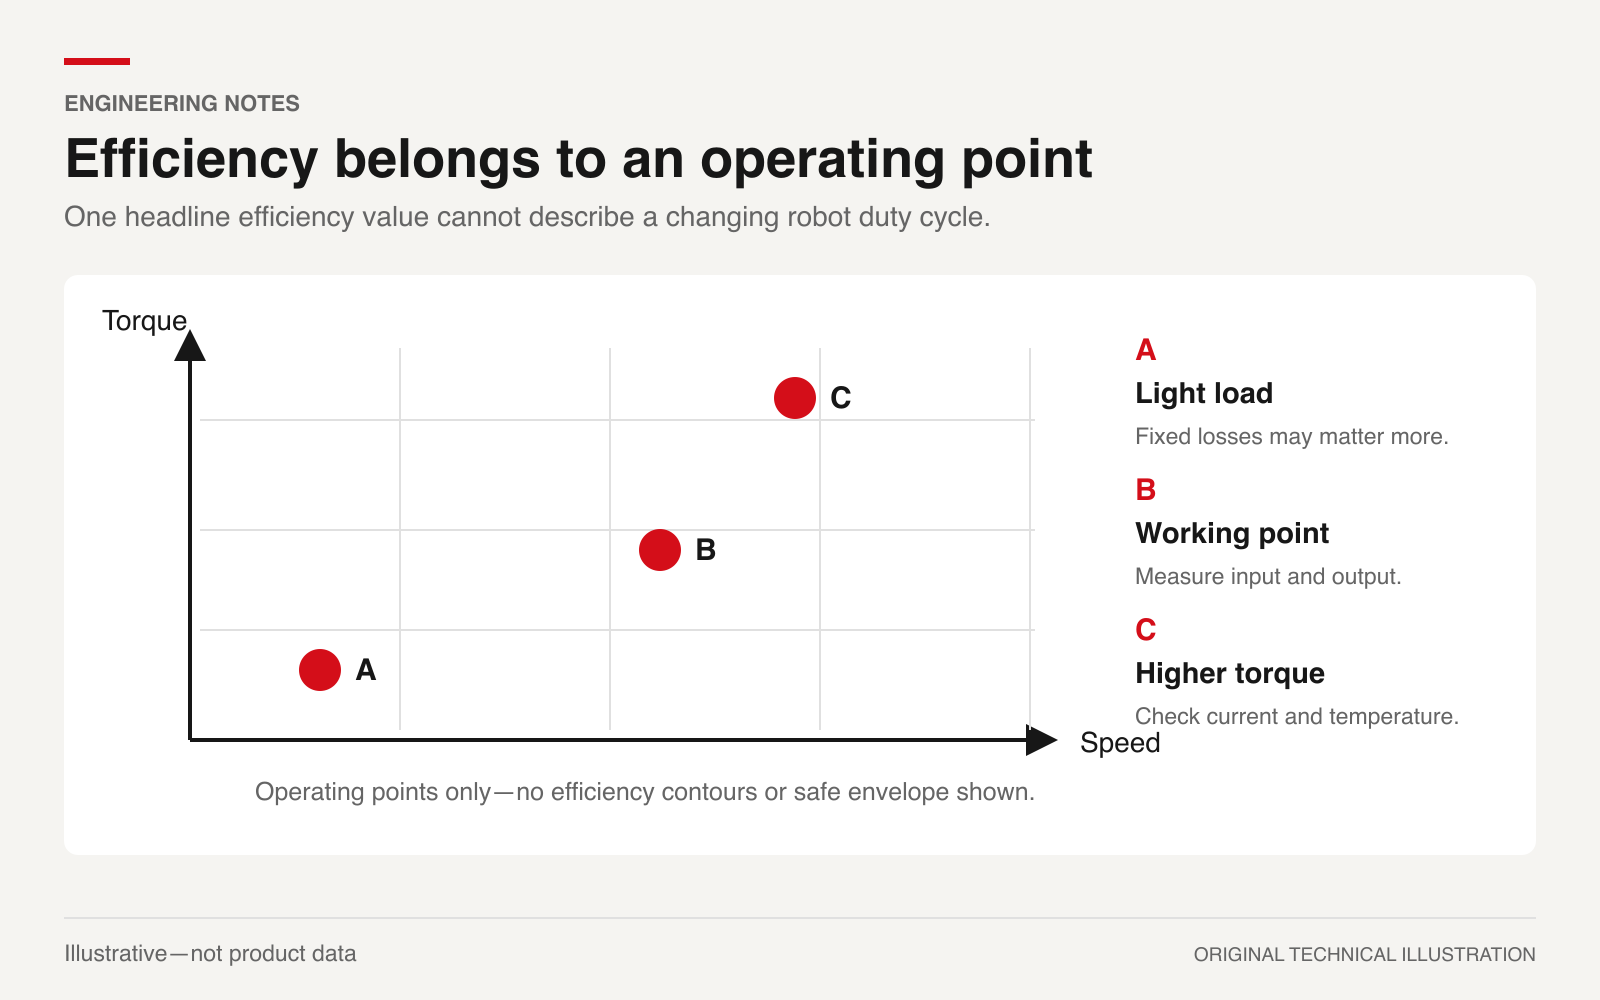
A peak efficiency value describes a particular condition. An efficiency map shows how the result changes across torque and speed. Read its test conditions as carefully as its contours: supply voltage, drive configuration and thermal state affect whether you can use it for your axis.
The official description of IEC 60034-2-3:2024 (external source) covers loss and efficiency testing of converter-fed AC motors and determining losses at torque–speed load points. Its scope includes induction and synchronous motors rated for the specified supply conditions. Referencing that scope does not establish that a particular robot actuator has been tested to the standard.
For an engineering comparison, mark the working points already defined by your motion requirement. If you still need those points, use the motor torque and speed calculation guide. Then ask for loss data at the slow, loaded regions as well as the faster travel regions. Include sustained holding as a separate thermal condition.
Swipe the table horizontally to see all columns.
| Information on a map or report | What to check before using it |
|---|---|
| Torque and speed axes | Motor shaft or joint output; units and direction |
| Test conditions | Bus voltage, drive settings, winding temperature and cooling |
| Coverage | Measured points, interpolated areas and regions outside the evidence |
| Published maximum | The exact operating point, boundary and duration behind it |
If two candidates lack overlapping test conditions, request comparable measurements. A smooth contour plot alone does not show measurement accuracy or continuous operating capability.
3. Low speed and holding need a separate judgment
Winding copper loss depends on current squared and winding resistance. In the simplest resistance model, doubling current produces four times the resistive loss when resistance stays constant. Actual three-phase calculations require the correct phase-current and resistance conventions.
At zero speed, mechanical shaft output power is zero even when the motor produces holding torque. If electrical input remains positive, the motoring output/input ratio is zero. That says little about the quality of the holding function; evaluate required current, temperature and allowable duration instead. MIT's actuator and drive-system notes (external source) develop the current, torque and winding-loss relationships using a DC motor model.
At nonzero speed, copper loss is only part of the picture. Core losses and mechanical friction also contribute, as described in the DOE sourcebook. Their relative importance changes with operation and motor construction. Avoid assuming that one fixed loss percentage applies throughout a robot joint's working range.
4. Convert an efficiency difference into lost watts
The thermal significance of an efficiency number becomes clearer when two candidates deliver the same mechanical output. For a steady motoring point:
P_loss = P_out × (1/η − 1)
The following values are illustrative assumptions, not SolisMotor specifications or test results. Both candidates deliver 100 W at the same output boundary, and the assumed efficiencies apply to that boundary under the comparison conditions.
Swipe the table horizontally to see all columns.
| Assumed condition | Efficiency | Loss within the defined assembly |
|---|---|---|
| Candidate A | 90% | 11.11 W |
| Candidate B | 94% | 6.38 W |
The four-percentage-point improvement reduces loss by about 4.73 W at this assumed point. That may matter in an enclosed joint, but it does not establish the temperature difference. The result depends on where the losses occur and how heat travels through the assembly.
If the boundary includes a drive and gearbox, the calculated loss belongs to the complete assembly. Assigning it all to the motor winding would give a misleading thermal model. During transients, changing stored energy also prevents you from treating every instantaneous input/output difference as heat.
5. Check the installed heat path
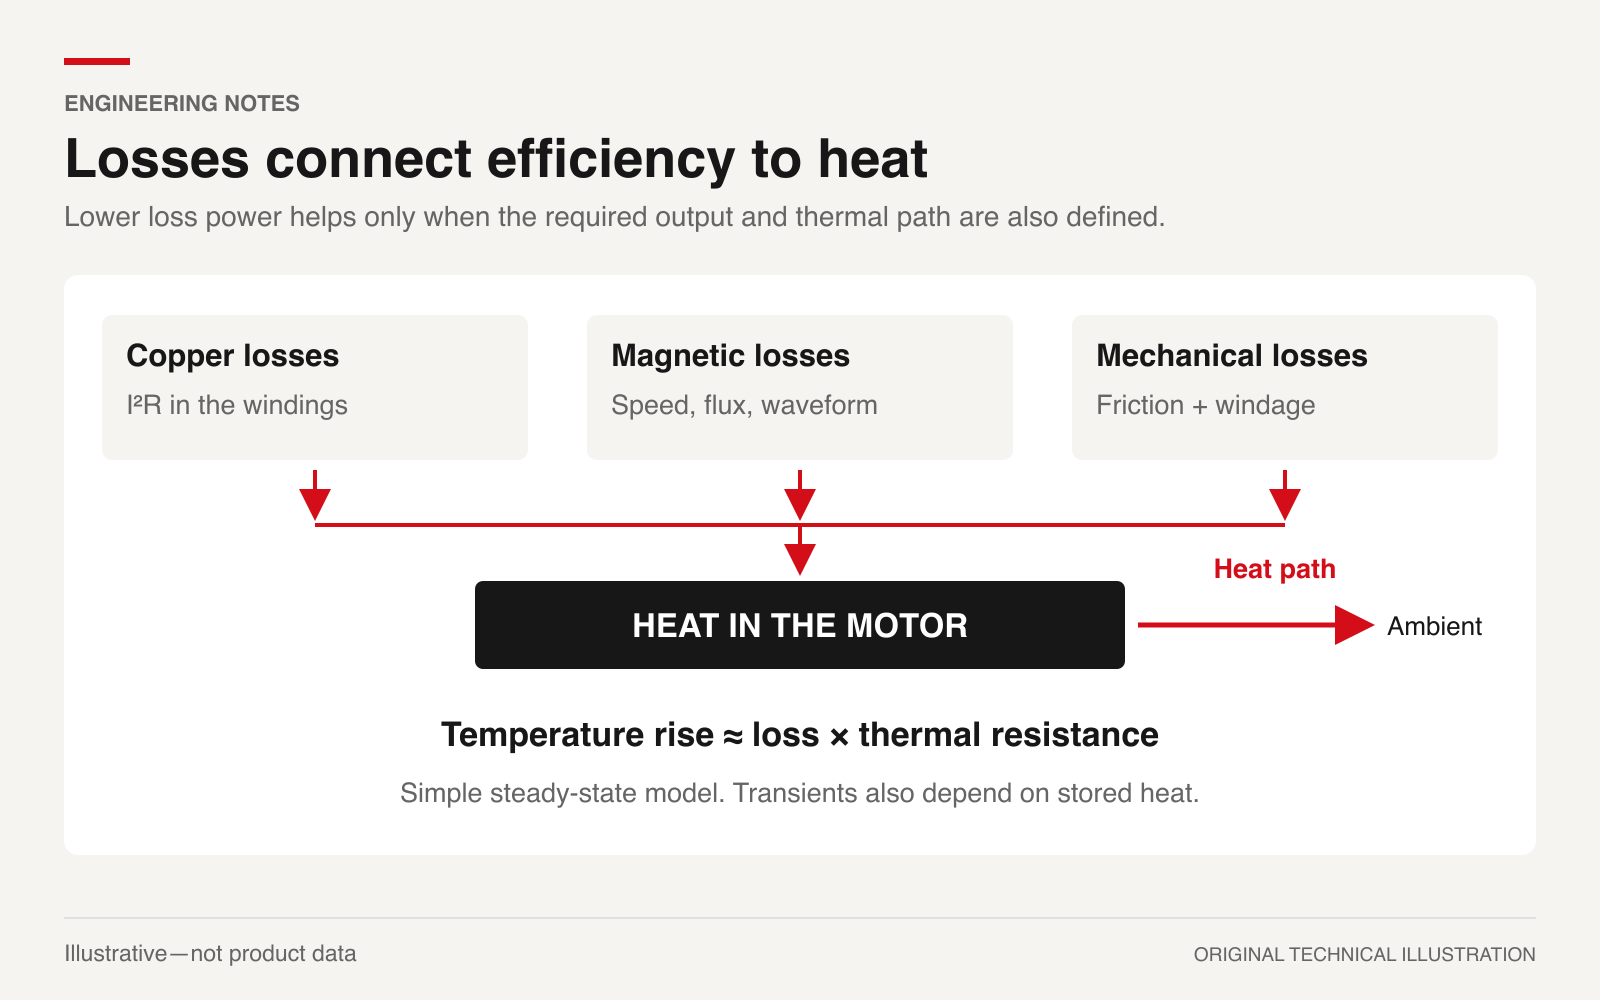
Lower losses reduce the heat that an assembly must dissipate at the compared output. Temperature also depends on the path to the surroundings: mounting contact, housing, airflow and neighboring heat sources. A short test on an exposed bench cannot establish the temperature reached inside an enclosed robot link after prolonged operation.
Colmenares and colleagues' research on thermal management of a miniature robot actuator (external source) used experimentally identified thermal parameters and considered changing winding resistance, friction, convection and a heatsink. Its actuator differs from a typical joint servo, so its numerical results should not be transferred to your design. The relevant lesson is to characterize the actual assembly and its cooling conditions.
Define which temperatures matter to acceptance: the winding, drive electronics and any other component with a specified limit. A housing sensor can be useful, but it does not directly measure every internal hot spot. Ask how the supplier relates reported temperature to those limits.
Use the robot-joint torque, heat and integration guide for the wider integration context. For the efficiency comparison, keep the mounting and cooling assumptions attached to each result.
6. Request measurements you can compare
An OEM evaluation report should let another engineer reproduce the relevant conditions. Agree on the following before testing:
- Identify the exact motor, drive, firmware and transmission configuration, plus the electrical and mechanical measurement boundaries.
- Specify representative torque–speed points and holding conditions, with the voltage range, ambient conditions and installed mounting arrangement.
- Record the thermal state and test duration. Distinguish a brief cold measurement from a thermally stabilized result.
- Use calibrated torque, speed and electrical-power instruments suited to the drive waveforms. Record how measurement uncertainty affects the reported efficiency and loss.
- Check the required motion and temperatures together. Document any derating, current limiting or control change during the test.
Near zero output, a small absolute measurement error can cause a large relative error in the efficiency ratio. At holding, report input demand and temperature rather than trying to rank actuators by that ratio. Request measured points where your design depends on the result; label estimates and extrapolations clearly.
7. Put efficiency evidence into the purchasing requirement
For an integrated product such as the MG-H49-12 hollow-shaft servo motor, first confirm the configuration being quoted. Its public description identifies an integrated motor, servo driver and position feedback. That integration makes the measurement boundary relevant to comparison with a separate motor-and-drive solution. The reviewed public page does not provide a measured efficiency map for your operating points; ask the engineering team for available test data instead of inferring efficiency from its power rating.
For procurement, separate what you require from what the supplier has demonstrated:
Swipe the table horizontally to see all columns.
| Requirement | Evidence to request |
|---|---|
| Acceptable losses during loaded motion | Efficiency or loss measurements at specified points and temperatures |
| Sustained holding without exceeding limits | Holding-current and temperature results for the stated installation |
| Continuous operation in the robot enclosure | A thermal test or validated model using comparable mounting and cooling |
| Comparable production configuration | Identification of the tested hardware, drive settings and agreed acceptance conditions |
SolisMotor's motor selection and integration services provide a relevant route for discussing these requirements. Supply your operating points and installation conditions, then confirm which measurements are available for the proposed configuration. Select against the required motion, thermal limits and comparable evidence, with efficiency evaluated at the points that matter to the robot.
FAQ
Is the highest peak efficiency the best choice for a robot joint?
Compare the candidates at your required operating points and under comparable test conditions. Peak efficiency may occur outside the region where the joint spends most of its working time or reaches its thermal limit.
Does a more efficient actuator always run cooler?
At the same mechanical output and measurement boundary, higher efficiency means lower total loss. Internal temperatures also depend on loss location and cooling, so the percentage alone cannot predict them.
Can rated power tell me motor efficiency?
A power rating alone does not provide both measured input and output at a common operating point. Request efficiency or loss data with the boundary and test conditions stated.